Your Monitoring Stack Is Lying to You — Just Not in the Way You Think
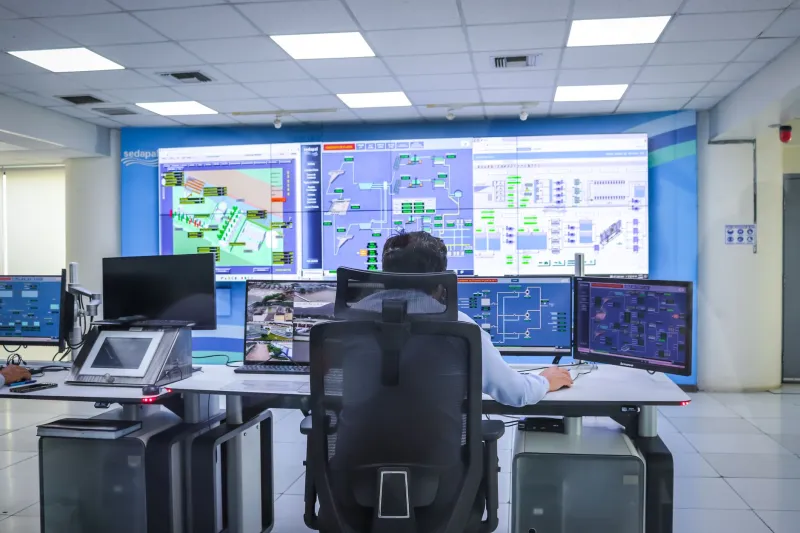
Let's paint a picture. Your on-call engineer is staring at a wall of dashboards. Everything looks green. P95 latency is within bounds. Error rates are nominal. The infrastructure health checks are all passing. And somewhere on the other side of those metrics, a user is trying to check out a cart, hitting a silent failure on the third step, and giving up.
You won't find out until the support ticket arrives — or until someone tweets about it.
This is observability theater: the practice of investing heavily in monitoring infrastructure that creates the feeling of operational awareness without actually delivering it. It's surprisingly common, and the teams that suffer from it usually have no shortage of tooling. They've got Datadog, Grafana, maybe a Honeycomb trial running somewhere. They've got alerts. They've got runbooks. What they don't have is a clear picture of what their users are actually experiencing.
The Data Abundance Problem
Modern observability tooling is extraordinary at collecting data. A reasonably instrumented service can emit thousands of metrics per second — request counts, queue depths, garbage collection pauses, database connection pool utilization, and on and on. Distributed tracing can give you a timeline of every hop a request makes through your system. Structured logging can capture context at a granularity that would have been unthinkable a decade ago.
All of that is genuinely useful. The problem is that data abundance creates its own failure mode: alert fatigue, dashboard sprawl, and a kind of operational noise that makes it hard to hear the signal.
When everything is being measured, the implicit assumption is that everything important is being measured. But that assumption breaks down in practice. You can have complete visibility into your infrastructure and zero visibility into whether users are successfully completing the flows that matter to your business.
Server-side metrics tell you about your system. They don't tell you about your users' experience of your system. Those are related, but they're not the same thing.
The Alert That Didn't Fire
Here's a failure pattern that shows up constantly in post-mortems: an incident that caused real user impact but didn't trigger any alerts because the system itself appeared healthy by every metric being tracked.
Silent failures are the hardest kind. A third-party API returning malformed JSON that your service swallows gracefully — no error, no exception, just a quietly broken user experience. A race condition in your checkout flow that only manifests under specific session conditions. A mobile client that's sending requests your backend is accepting and silently ignoring because of a schema mismatch introduced three releases ago.
None of these show up in your CPU graphs. None of them spike your error rate if the errors aren't being surfaced correctly. Your dashboards stay green. Your users suffer.
The gap isn't in your tooling. It's in your instrumentation philosophy. You're measuring what's easy to measure — infrastructure health, system-level metrics — rather than what's important to measure: user-facing outcomes.
Moving from System Metrics to User Signals
The shift that actually changes things is reorienting your observability strategy around what users are trying to do, rather than around what your infrastructure is doing.
This means thinking about your critical user journeys first. What are the three to five flows that, if broken, would immediately impact your core value proposition? Signup and activation. Purchase completion. File upload and processing. API key generation. Whatever it is for your product — those flows need to be explicitly monitored, not just inferred from aggregate metrics.
Synthetic monitoring is underused for exactly this purpose. Scripted user journeys that run against production on a regular cadence can catch broken flows that your infrastructure metrics will never surface. If your synthetic checkout flow fails, you know about it before your users do. That's a fundamentally different posture than waiting for support tickets.
Real user monitoring — capturing what's actually happening in client-side code — closes another gap that server-side metrics can't address. Your backend might be responding fine. The client might be doing something unexpected with that response. You won't know unless you're looking.
Fixing Your Alert Strategy
Most teams' alert configurations are the result of years of accumulated reaction rather than deliberate design. Someone got paged for high CPU once, so there's now a CPU alert. A database ran out of connections, so there's an alert for that. Over time you end up with dozens of alerts, many of which fire regularly and get acknowledged and ignored because they don't correspond to actual user impact.
This is the alert fatigue spiral. When everything pages, nothing pages — because the on-call engineer has learned to treat alerts as noise until proven otherwise.
A more sustainable approach is to start from the other direction: what conditions, if true, mean a user is definitely having a bad experience right now? Those are your high-priority alerts. Everything else is diagnostic information that can live in a dashboard you consult during an investigation, not something that wakes someone up at 2 AM.
Service Level Objectives are useful precisely because they force this conversation. Instead of asking "is our error rate above X%?", you're asking "are we meeting the experience bar we've committed to for our users?" That framing keeps user impact at the center of the conversation.
Building Observability That Actually Observes
The goal isn't fewer dashboards or simpler tooling. It's clarity about what you're looking at and why.
Start by auditing what you're actually monitoring against the list of things that would genuinely hurt your users if they broke. The gaps between those two lists are where your blind spots live. Fill those gaps with instrumentation that's explicitly tied to user outcomes — completion rates, not just request rates; error categories that map to user-visible failures, not just HTTP status codes.
Then build your alert layer on top of that, with ruthless prioritization. If an alert doesn't correspond to something a user is experiencing right now, it shouldn't be waking anyone up.
The teams that get this right don't have fancier tooling. They have clearer thinking about what observability is actually for. It's not a compliance exercise. It's not a dashboard aesthetic. It's the difference between knowing your system is up and knowing your users are okay. Those are not the same thing, and conflating them is how you end up staring at green dashboards while your users quietly churn.